

ReflexClient Cubes is a decision support module that enables you to explore the data of the VoluPack, VoluPrim, VoluLabel and Prosper ERP. The modular offer proposes various data “cubes” dedicated to the following areas: estimates, orders, invoicing, purchases, cost price, production, delivery (evolving list). ReflexClient Cubes can operate as a stand-alone module or integrated with ReflexClient CRM.
Discover ReflexClient Cubes in a video:
Video to watch in full screen.
Easily design dashboards.
- A simple, intuitive graphical interface allows the end user to build customizable charts, graphics and lists in a few clicks.
- Independent working mode: synchronize your cubes in one click and analyse your data when you’re on the road.
- Confidentiality and restricted access to data: typically, a sales representative can only access to the data of the customers he manages.
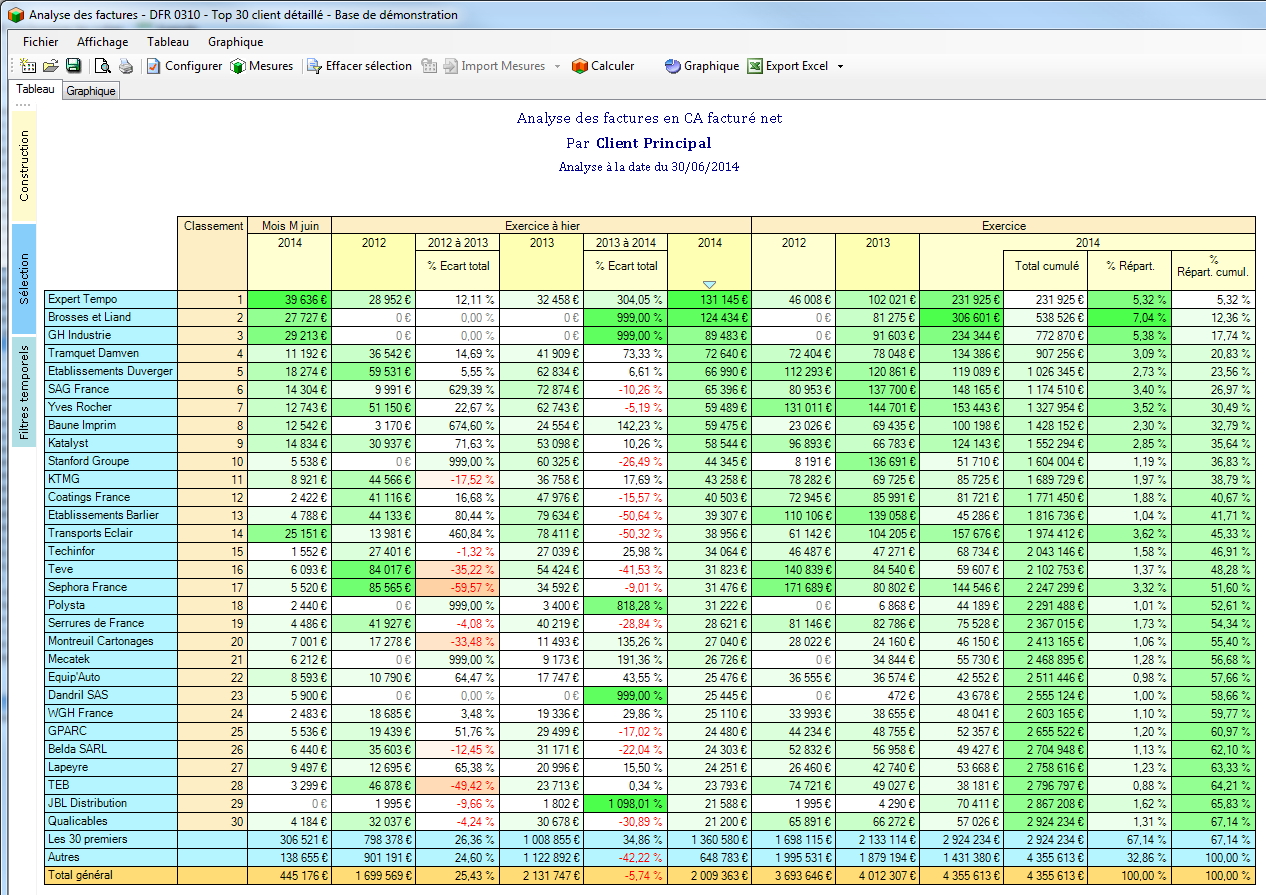
ReflexClient Cubes : a cutomer Top 30 in a few clicjs
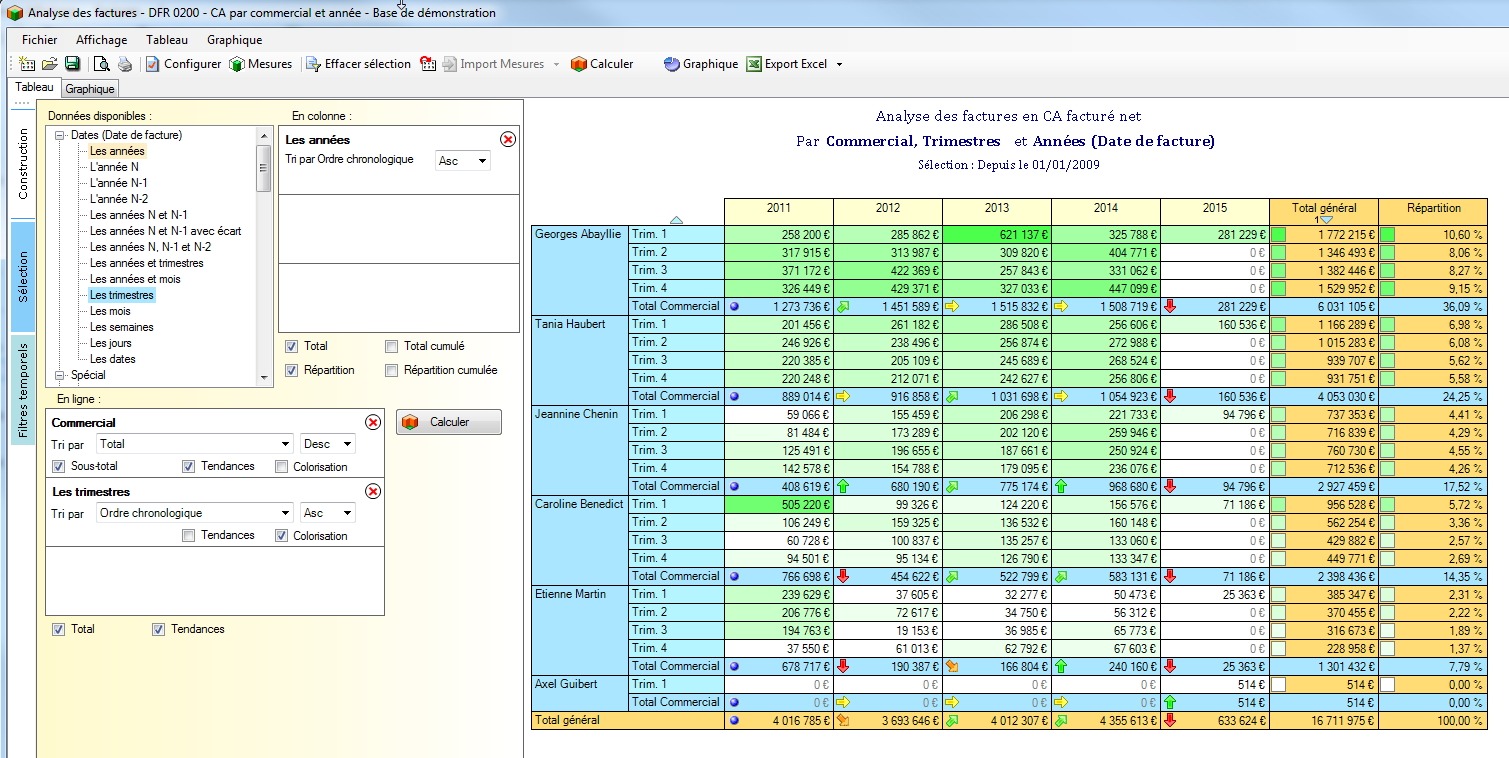
The charts are automatically generated according to the analyses performed. You can choose among many chart types in a single click: curves, histograms, sectors, donuts, pyramids, funnels, etc.
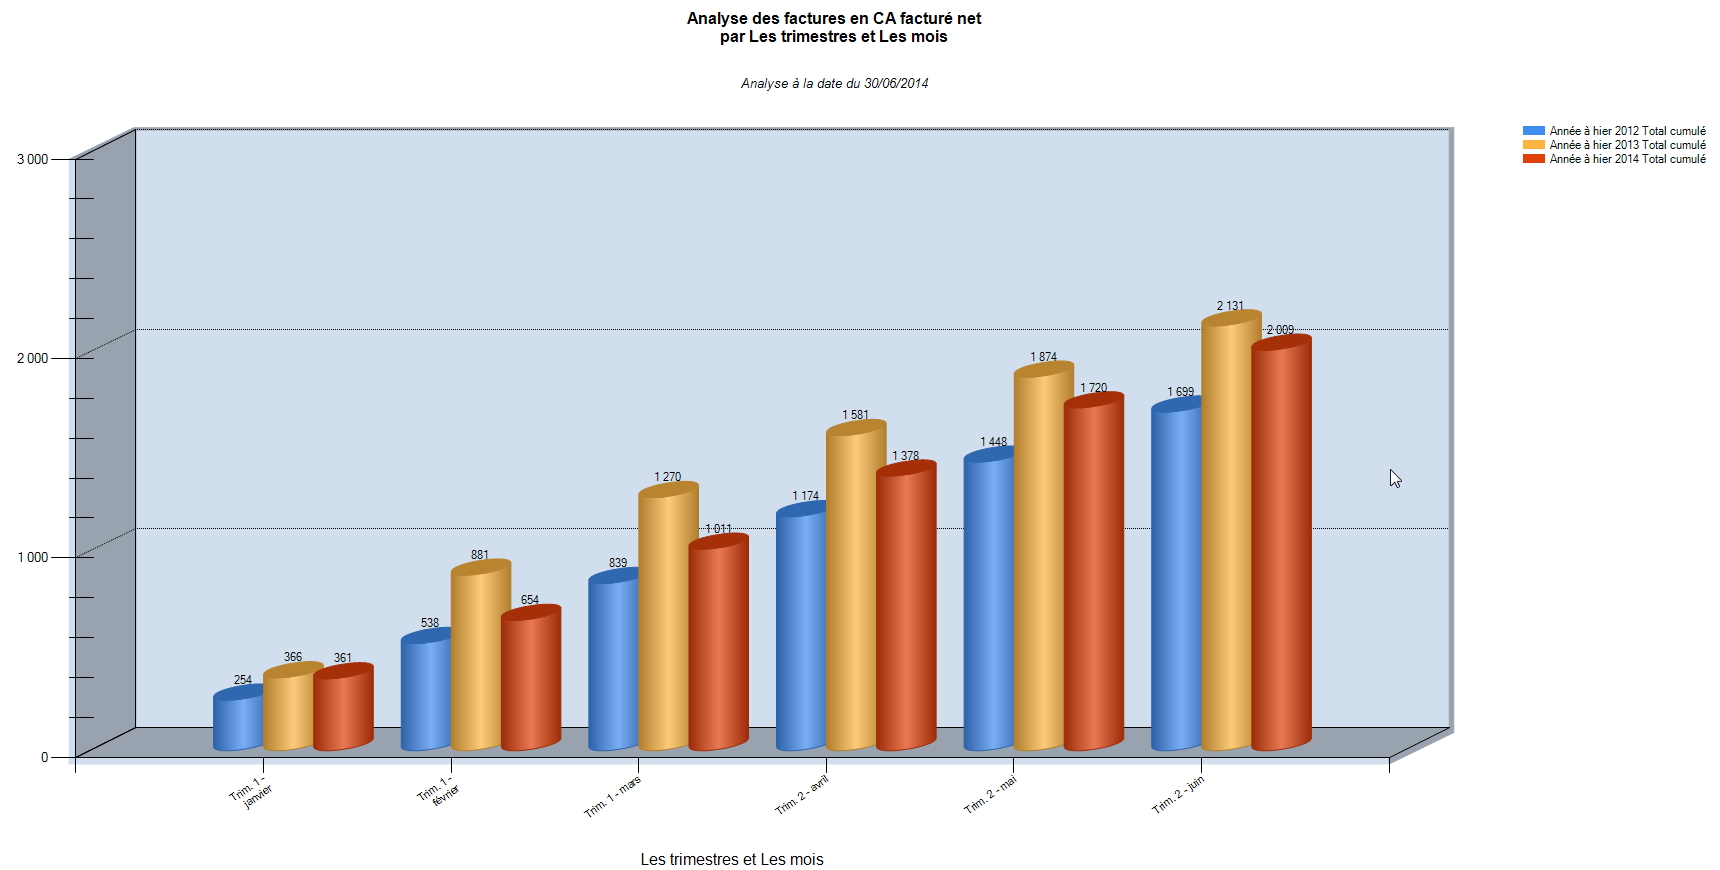
ReflexClient Cubes : analysis of the evolution of the turnover N, N-1, N-2 for the last 6 months
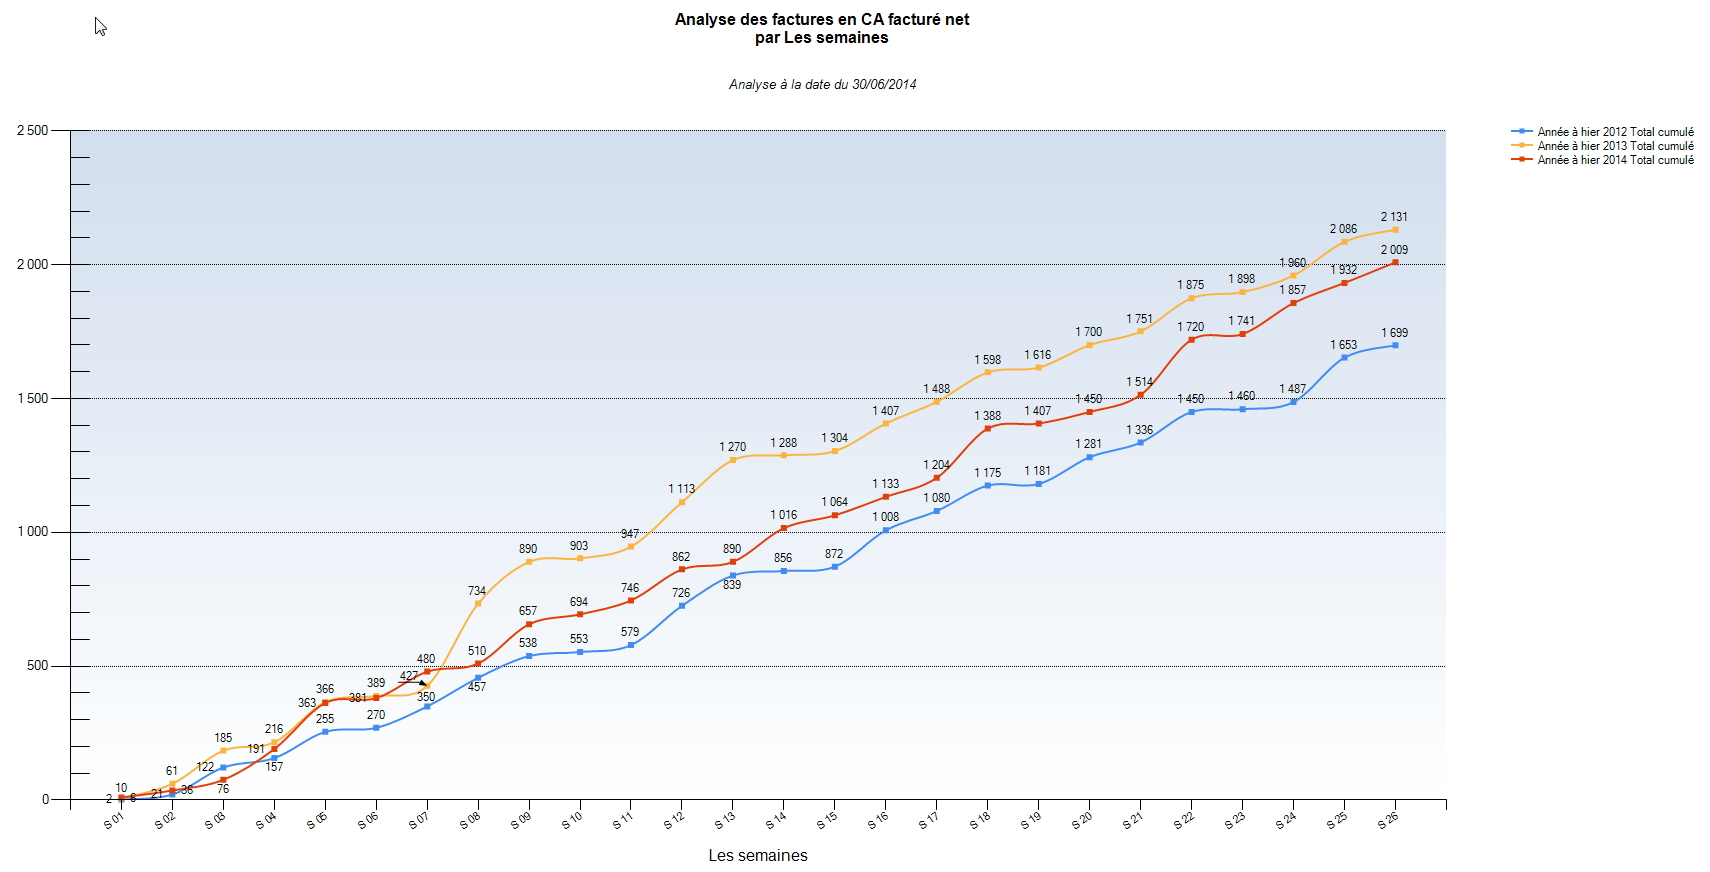
ReflexClient Cubes : trend evolution of the turnover N, N-1, N-2 per week
Build your cubes with complete autonomy.
With ReflexClient Cubes, the end user is independent when designing his charts and graphs. No computer skill is required. All it takes to have a ready-to-use cube is drag and drop data and measures in the build panel !
ReflexClient Cubes : building a cube. The end user is independent.
Analyzing data: understanding malfunctions.
Not only does ReflexClient Cubes build charts. It also gives you the possibility to “dig” into the data when you wish to know more about a figure. The data breakdown feature gives you an in-depth look of a customer, a reference, and even more accurately to the invoice level if needed.
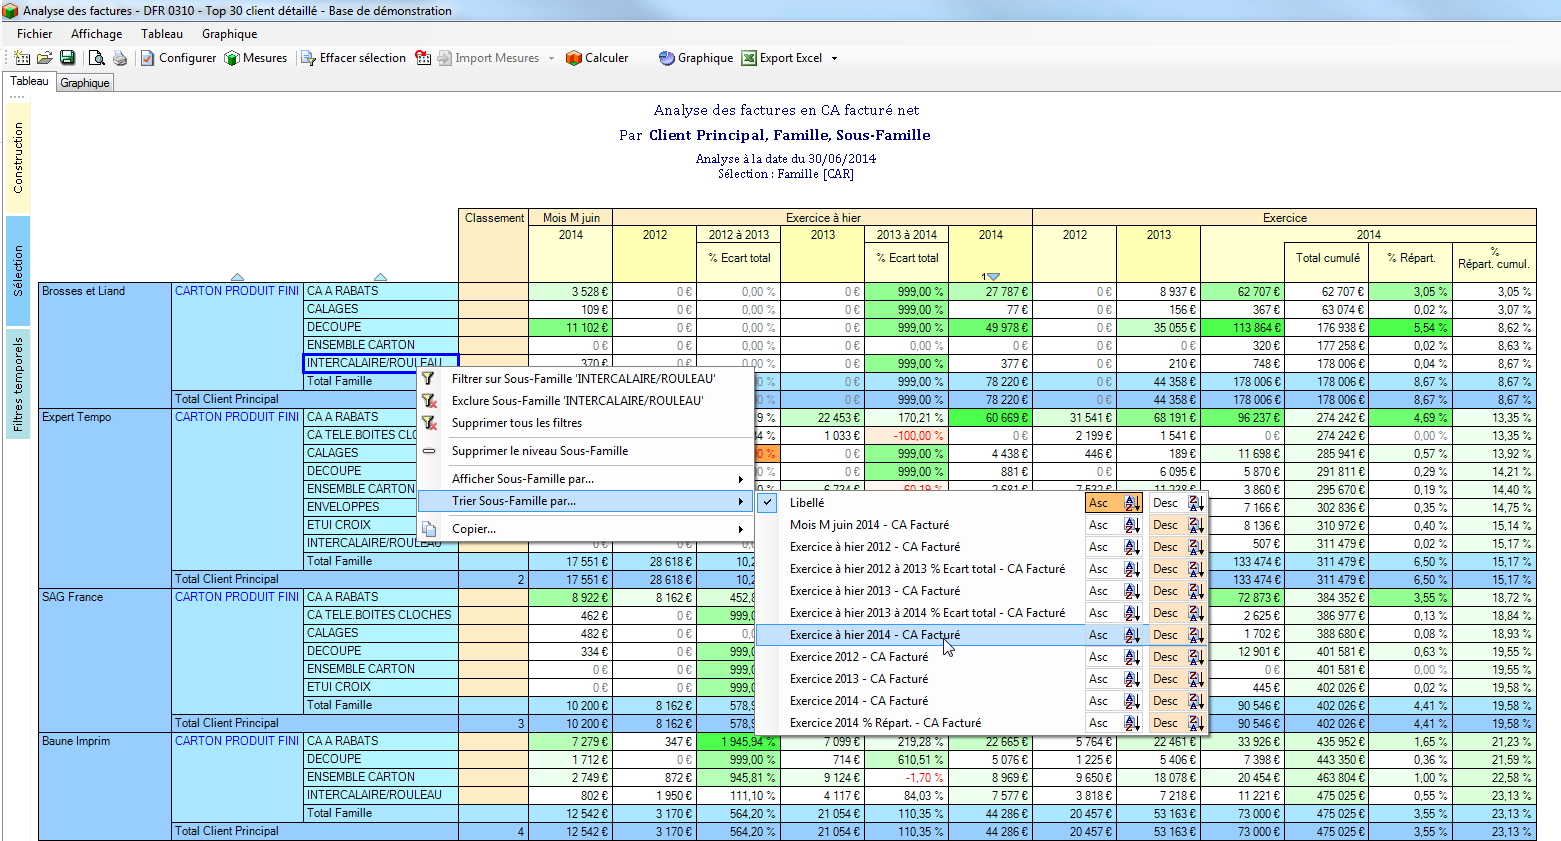
ReflexClient Cubes : breakdown, sort, filter, to better understand data.
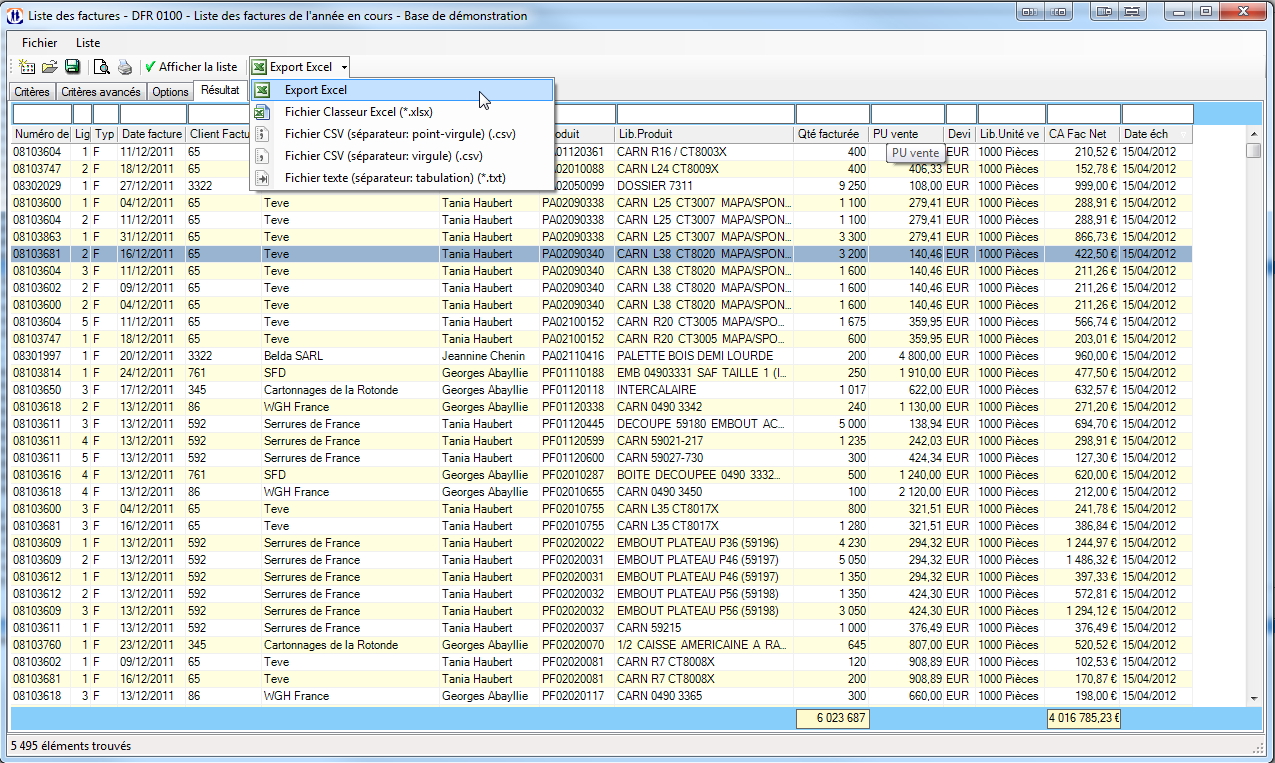
The configurable lists.
For each field covered (estimates, orders, invoicing, purchases, cost price, production, etc) (evolving list), you can build cubes, but also configurable lists. For example, in the case of he “invoice cube” these lists can give you the details of all the lines of the invoice. In these lists, you can easily find the information sought for, thanks to quick filters. These lists can be exported to Excel (or Open Office) in a single click.